
Bitcoin’s Critical Juncture: Analyst Outlines Three Key Paths for BTC After Breaking Below $60,000


Bitcoin (BTC) has recently experienced a significant price movement, dipping below the psychologically and technically important $60,000 threshold. This breach has triggered concerns among investors and analysts alike, prompting a re-evaluation of potential short-to-mid-term price trajectories. Prominent crypto strategist, known as "Market Beggar" on X (formerly Twitter) and a regular contributor to Blocktempo, has outlined three distinct scenarios for Bitcoin’s price action following this critical breakdown. These pathways consider various technical and on-chain indicators, suggesting potential bottoming zones and the conditions under which they might be activated. Currently, the market is characterized by shrinking trading volumes and a period of consolidation between bullish and bearish forces, making these analytical frameworks particularly pertinent for navigating the immediate future of Bitcoin. Investors are advised to pay close attention to the unfolding of these three detailed scenarios as they could dictate the cryptocurrency’s direction in the coming weeks.
Background and Market Context
The $60,000 price level has served as a crucial support and resistance zone for Bitcoin throughout its history, particularly since its meteoric rise in previous bull cycles. A sustained break below this level often signals a shift in market sentiment and a potential for further downside, prompting liquidation events and testing the resolve of long-term holders. Conversely, reclaiming this level quickly can indicate a strong underlying demand. The current market dynamics are complex, influenced by a confluence of factors including macroeconomic uncertainty, fluctuating interest rate expectations, and the evolving landscape of institutional adoption through spot Bitcoin Exchange-Traded Funds (ETFs). While ETFs initially spurred significant inflows and propelled Bitcoin to new all-time highs earlier in the year, recent weeks have seen a moderation in demand, and even some outflows, contributing to the downward pressure. The Bitcoin halving event in April, historically a bullish catalyst, has also not yet translated into immediate price appreciation, leading to a "post-halving lull" that often precedes more substantial price movements. In this environment, detailed technical and on-chain analysis, such as that provided by Market Beggar, becomes invaluable for market participants seeking clarity.

The Significance of Liquidity Zones
At the heart of Market Beggar’s analysis lies the concept of "liquidity zones." In financial markets, liquidity refers to the ease with which an asset can be converted into cash without affecting its market price. However, in the context of technical analysis and order flow, "liquidity" also refers to areas on a price chart where a large number of buy or sell orders are concentrated. These concentrations, often around significant price levels, act as magnets for price action. When the price approaches a liquidity zone, it can either find strong support or resistance, or it can "sweep" through it to trigger stop-loss orders (a "stop hunt") or fill pending limit orders, often leading to rapid price movements. Understanding these zones is crucial for anticipating market reactions and identifying potential turning points. Market Beggar’s framework specifically identifies a "seller liquidity accumulation zone" below $60,000, indicating a concentration of sell orders that could be triggered or absorbed as the price descends.
Path 1: Block Structure Retest and Bottoming ($59,000-$61,000)
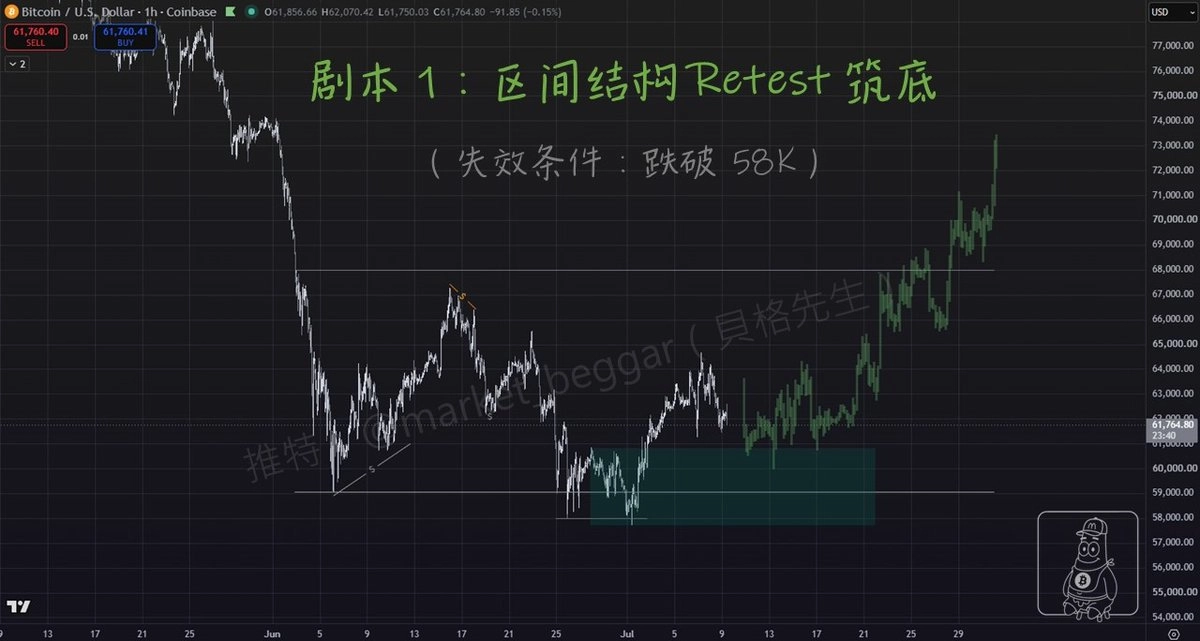
Market Beggar’s initial and most immediate scenario suggests a "block structure retest and bottoming" in the range of $59,000 to $61,000. This pathway posits that after Bitcoin’s breakdown below $60,000 on July 1st, the market initiated a "Stop Hunt" downwards. A Stop Hunt is a common market manipulation tactic where large players intentionally drive the price to a level where many stop-loss orders are concentrated, triggering them and generating artificial liquidity for their own trades. Following this initial sweep, the price then attempts to "retest" a previously significant level or range, confirming its new status as either support or resistance.

In this scenario, the retest is expected to occur within the $59,000-$61,000 band. The analyst’s argument is that if Bitcoin successfully re-establishes a base within this range, it would confirm a block structure bottom, suggesting that the initial dip was primarily a liquidity grab rather than a fundamental shift in trend. As of the analysis, the price had already touched this designated bottoming range, indicating that the market was actively testing this first hypothesis.
However, this path comes with a crucial risk and caution: if Bitcoin breaks below a specific "black line" identified at $57.8K, which is likely a key support level triggered by the earlier Stop Hunt, then additional long positions or defensive measures might be necessary for those following this strategy. The failure to hold $57.8K would signal the invalidation of this immediate bottoming scenario, pushing the market towards deeper support levels. This initial path represents a hopeful, yet cautious, outlook for a relatively quick stabilization and rebound for Bitcoin, assuming the underlying market structure remains intact above the critical $57.8K mark.
Path 2: Bullish Liquidity Structure Bottoming (Critical Point at $57.8K)
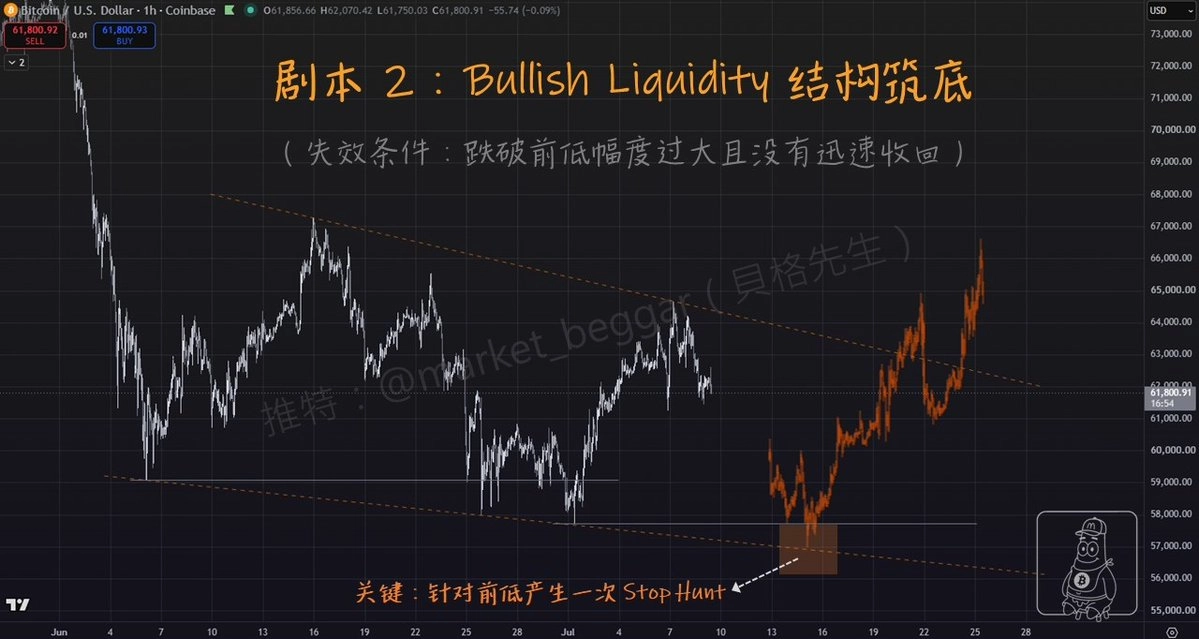
Should Path 1 fail to hold, Market Beggar posits a transition to a more bearish, yet still recoverable, scenario: a "Bullish Liquidity structure bottoming." This path is contingent upon Bitcoin’s price continuing its descent beyond the block structure outlined in Path 1, particularly if it breaks below the critical equilibrium point of $57.8K. The concept of "Bullish Liquidity" refers to areas where a high concentration of buy orders (often from long positions or potential long entries) are clustered. When the price falls into such an area, it can trigger stop-loss orders for existing long positions or fill pending buy orders, effectively "clearing" the bullish liquidity from the market.
According to the analysis, a breach of the $57.8K equilibrium point would lead Bitcoin into a deeper "Stop Hunt" zone, specifically targeting liquidity below this level. If the price is unable to sustain itself within this deeper block structure—meaning it cannot find sufficient buying pressure to reverse its course—then the expected bottoming for this Path 2 scenario would be invalidated. This implies that the market would not find sufficient demand to absorb the selling pressure at these levels, leading to a further decline.
The observation for this path emphasizes the importance of the $57.8K level as a pivotal point. A breakdown here suggests that more significant bullish positions are being challenged, and the market is undergoing a more profound liquidation event. The risk associated with this path is clearly defined: a failure to hold the range below $57.8K after a break would necessitate a reconsideration of the Bullish Liquidity structure bottoming. Such an outcome would indicate that the market is not yet ready for a sustained rebound and that more substantial capitulation might be underway, paving the way for the third, more severe, scenario. This path highlights the market’s propensity to seek out and clear concentrated liquidity to establish a more robust foundation before a potential recovery.
Path 3: Deep Bear Valuation Model Bottoming Zone ($50,000-$53,000)
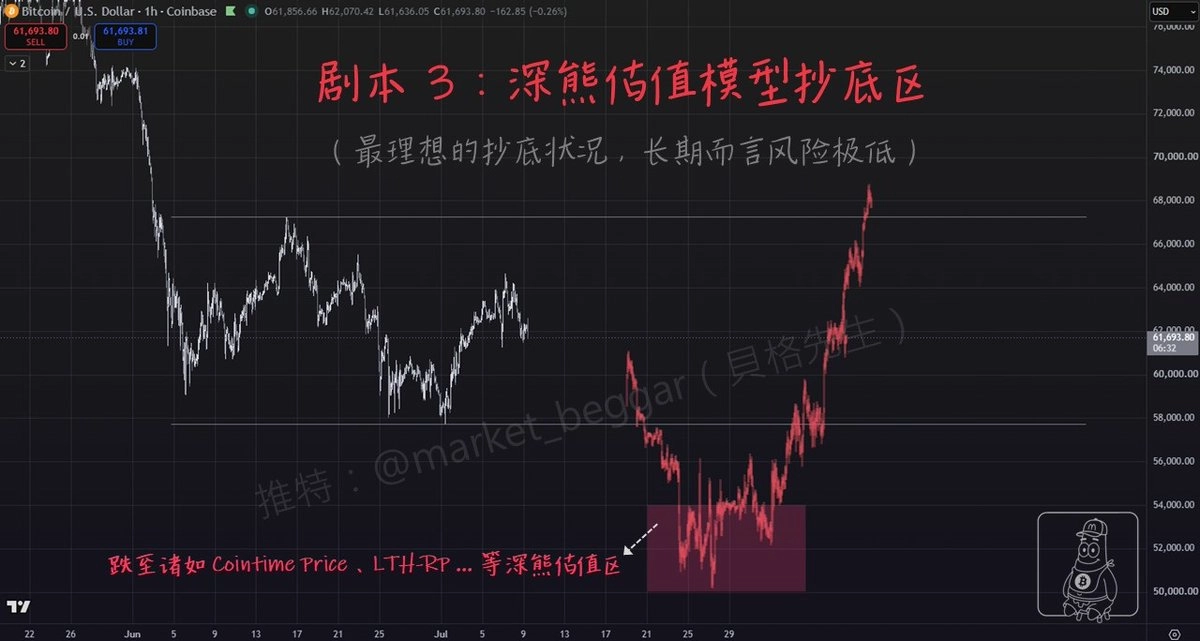
The most bearish, yet historically validated, scenario outlined by Market Beggar is the activation of the "Deep Bear Valuation Model Bottoming Zone." This path is considered only if both Path 1 and Path 2 fail, signifying a significant deterioration in market conditions and a deeper correction than initially anticipated. The "Deep Bear Valuation Model" is presented as a proprietary analytical tool or an on-chain metric with a remarkable track record, boasting a "100% success rate for past triggers." If this model is triggered, it implies that Bitcoin is entering a "deep bear market" phase, where prices are likely to fall into the $50,000-$53,000 range.
The implication of this path is profound. A move to $50,000-$53,000 would represent a substantial correction from Bitcoin’s recent highs and a significant breach of psychological support levels. This scenario typically involves widespread capitulation, where even long-term holders might be forced to sell, creating a "true bottom" from which a new bull cycle could eventually emerge. The historical accuracy of Market Beggar’s model lends weight to this dire prediction, suggesting that while it is a worst-case scenario, it is one that demands serious consideration from investors.
However, even if this Deep Bear Valuation Model is triggered and Bitcoin enters the $50,000-$53,000 zone, Market Beggar issues a critical caution. Historical data associated with this bottoming zone suggests that the market conditions upon entry would likely be characterized by "extremely high trading volume, extreme volatility, and extreme uncertainty." This means that even within the identified bottoming range, price stability is not guaranteed immediately. Investors should be prepared for continued erratic price movements and a prolonged period of consolidation before any meaningful recovery can take hold. The analyst emphasizes that the BTC price might still be subject to further movements based on these "triggered parameters," highlighting that even a deep bottom can be a volatile and challenging environment to navigate. This path underscores the potential for severe market downturns but also identifies a historically reliable zone for long-term accumulation for those willing to brave the volatility.
Current Market Outlook and Implications
As Bitcoin navigates these uncertain waters, the broader market remains in a state of flux. The shrinking trading volume observed recently indicates a lack of conviction from both buyers and sellers, leading to the "long-short consolidation" highlighted by Market Beggar. This sideways movement, often accompanied by increasing volatility as price tests different levels, is typical of periods preceding significant directional shifts. The analyst’s emphasis on monitoring these three distinct scenarios provides a structured framework for investors to interpret market signals and adjust their strategies accordingly.
The implications for various market participants differ significantly across these paths. For short-term traders, the identification of precise retest zones and critical breakdown levels like $57.8K offers clear entry and exit points, albeit with high risk. Long-term investors, on the other hand, might view the deeper scenarios, particularly the $50,000-$53,000 range, as potential accumulation opportunities, banking on the historical resilience and long-term growth trajectory of Bitcoin.
It is crucial for investors to remember the inherent volatility of the cryptocurrency market and to approach these analyses with a discerning eye. While Market Beggar’s insights are detailed and based on specific technical and on-chain models, they remain projections. The final disclaimer from the analyst – that these are "personal opinions" and "do not constitute investment advice" – serves as a vital reminder for all market participants to conduct their own due diligence and consider their individual risk tolerance before making any investment decisions. The coming weeks will be pivotal in determining which of these paths Bitcoin ultimately takes, and how quickly the market can find a stable foundation for its next move.
Related posts: