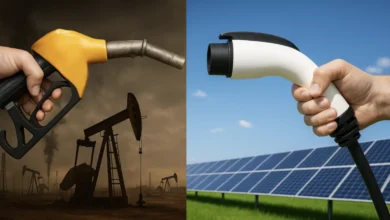
US Renewable Energy Capacity Set to Outpace Natural Gas as Clean Power Surges, New EIA Data Shows

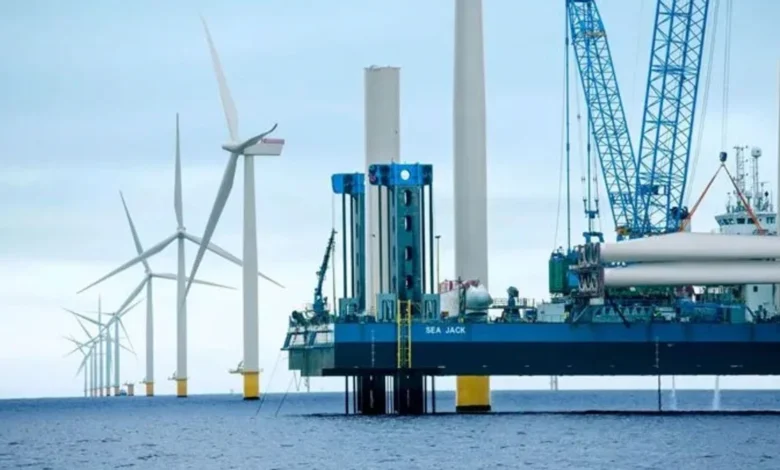
The landscape of American energy production is undergoing a historic and accelerating transformation. Over the coming year, renewable energy sources are projected to expand their footprint dramatically, with their share of total US generating capacity slated to climb from 37.7% to 40.4%. According to newly released data from the US Energy Information Administration (EIA), which was recently analyzed by the clean energy advocacy group the SUN DAY Campaign, renewables are not only extending their lead over traditional fossil fuels but are also on track to vastly outperform nuclear energy. By the summer of 2027, the combined capacity of wind, solar, and hydroelectric power will comfortably surpass that of natural gas, marking a monumental shift in how the United States powers its economy, homes, and burgeoning electric vehicle fleet.
This rapid expansion comes on the heels of unprecedented growth over the previous twelve months. Figures drawn from the EIA’s latest Electric Power Monthly report, which captures generation and capacity data through August 31, 2026, illustrate an energy sector in the midst of a green revolution. During the first eight months of 2026, total renewable electricity generation grew by 10.2% compared to the same period in the previous year. This compounding momentum has reinforced the position of renewables as the primary driver of new electrical capacity across the country.
A Comprehensive Look at Generation and Growth in 2026
The steady march of clean energy is underscored by impressive individual performances across various renewable technologies. Between January and August 2026, wind energy established itself as a cornerstone of the American grid, producing 333,367 gigawatt-hours (GWh) of electricity, which accounts for roughly 10.6% of total US electrical generation. Hot on its heels is solar power. When combining utility-scale operations with small-scale residential and commercial arrays, solar installations produced 329,119 GWh, capturing 10.5% of the domestic energy market.
Hydropower added a reliable 180,940 GWh (5.7% of the total), while biomass and geothermal contributions rounded out the renewable portfolio with 29,917 GWh (1.0%) and 10,766 GWh (0.34%), respectively. Combined, all renewable energy sources accounted for 28.1% of total US electrical generation through the first two-thirds of the year, representing a notable leap from the 26.2% recorded during the same timeframe in 2025.
In stark contrast, the output from conventional power sources grew at a much sluggish pace or contracted entirely. Electrical output from natural gas and nuclear facilities edged upward by just 2.6% and 1.3%, respectively. Meanwhile, coal-fired generation experienced a sharp decline, plummeting by 8.7% as aging plants continue to be phased out in favor of cheaper, cleaner alternatives. During the first eight months of the year, wind and solar power combined produced 44.4% more electricity than coal and 24.8% more than nuclear energy, demonstrating that renewables have moved past the threshold of being alternative options to become foundational pillars of the grid.
Unprecedented Capacity Additions Outpace Fossil Fuels
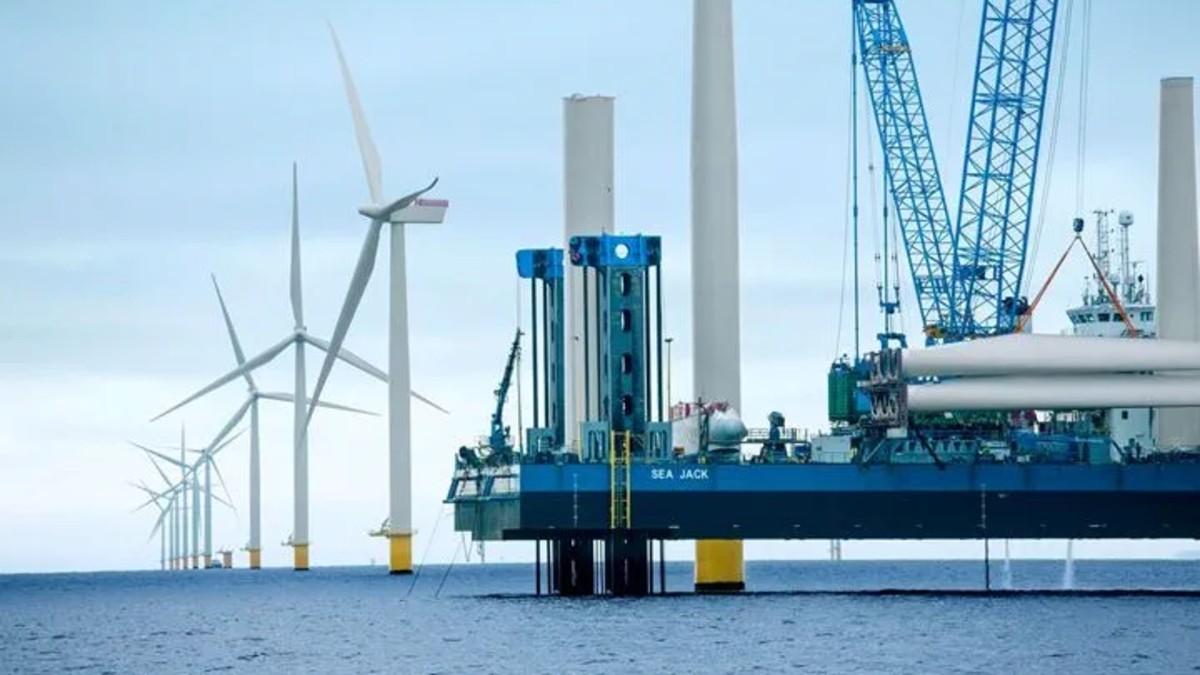
The physical expansion of the grid tells an equally compelling story. Between September 1, 2025, and August 31, 2026, the United States added more than 43,000 megawatts (MW) of new renewable energy capacity. Utility-scale solar led the charge with a staggering 27,141.7 MW of new installations. Small-scale residential and commercial solar grew by 6,526.1 MW, while wind energy added 9,979.1 MW—a figure that includes 800 MW of newly commissioned offshore wind capacity.
Furthermore, the integration of energy storage has kept pace with generation. Utility-scale battery energy storage systems expanded by 17,586.9 MW over the same twelve-month period, addressing intermittency concerns and providing crucial grid stability.
When evaluating these gains against the traditional energy sectors, the disparity in investment and deployment becomes glaring. Over the past year, coal capacity dropped by 2,703.4 MW, and nuclear capacity remained virtually unchanged. Although natural gas capacity saw a modest net increase of 5,316.0 MW, the combined net new capacity for fossil fuels and nuclear power totaled a mere 2,612.6 MW. Consequently, renewable energy capacity expansion was nearly 17 times greater than the combined growth of fossil fuels and nuclear power.
Projections for the Coming Year Point to Accelerated Deployment
Looking ahead, the EIA projects that the pace of clean energy adoption will only accelerate. Utility-scale renewables are slated to add over 53 gigawatts (GW) of new capacity in the coming twelve-month cycle, representing a roughly 44% increase over the previous year’s additions.
As of September 1, 2026, renewable energy constituted 34.5% of total US utility-scale generating capacity. The EIA forecasts this figure will climb to 37.3% by August 31, 2027. Utility-scale solar is projected to add a massive 44,603.1 MW, boosting its share of utility-scale capacity from 13.4% to 16.5%. Wind energy is expected to grow by another 8,312.3 MW—including 3,355.0 MW of offshore wind—holding its share steady at approximately 13.5%. Other renewables, such as hydropower, biomass, and geothermal, are anticipated to contribute an additional 201.9 MW.
Conversely, the EIA anticipates zero new nuclear generating capacity coming online in the near term, alongside a net reduction of 1,997.0 MW in fossil fuel capacity as older thermal plants are permanently retired.

Small-Scale Solar and the Path to Surpassing Natural Gas
One of the most remarkable milestones on the horizon involves distributed, small-scale solar systems. While the EIA’s utility-scale forecasts capture massive solar farms, millions of rooftop panels and commercial solar installations operate outside these specific metrics.
Small-scale solar grew by 6,526.1 MW over the past year, bringing its cumulative installed capacity to 63,192.6 MW. While the EIA does not formally forecast distributed solar growth, historical trends compiled by independent analysts—such as the SUN DAY Campaign—suggest that an additional 6,000 MW or more will be deployed over the next year, mirroring the average annual growth observed over the past five years.
If small-scale solar achieves this projected milestone by September 1, 2027, total installed renewable energy capacity in the United States will eclipse 550,000 MW (550 GW). This would officially push renewables past natural gas, whose projected generating capacity for the same period sits at approximately 518,312.8 MW. Solar power alone is on track to account for more than one-fifth (20.7%) of the nation’s entire electricity generating capacity.
Battery Storage Growth Strengthens Grid Resiliency
To support this massive influx of variable renewable energy, energy storage is expanding at a historic rate. The EIA forecasts that utility-scale battery storage will surge by nearly 44% over the coming year, adding 23,656.2 MW by September 1, 2027, and bringing the national total to 77,753.2 MW.
When combining utility-scale renewable sources and battery storage, the US grid is poised to absorb roughly 76,773.5 MW of new clean energy infrastructure by late summer 2027. Factoring in distributed small-scale solar, the total new generating and storage capacity coming online could approach 83 GW.
Industry leaders view these milestones not as temporary anomalies, but as the inevitable trajectory of a modernizing energy economy. Ken Bossong, executive director of the SUN DAY Campaign, emphasized the unstoppable nature of the transition during a review of the latest federal data.

"Each new issue of EIA’s Electric Power Monthly reinforces the theme that the growth of solar, wind, and battery storage has become unstoppable," Bossong noted. "Meanwhile, the share of the nation’s electrical generation and generating capacity provided by fossil fuels and nuclear continues to shrink."
Economic and Strategic Implications of the Green Transition
The rapid transition away from fossil fuels toward an electricity grid powered predominantly by renewables and battery storage carries profound economic, environmental, and geopolitical implications.
Economically, the plummeting costs of solar panels, wind turbines, and lithium-ion batteries have made clean energy the most cost-effective option for new power generation in the vast majority of the United States. Utilities and independent power producers are increasingly finding that building new solar and wind farms—paired with storage—is significantly cheaper than maintaining or constructing expensive fossil-fuel-burning plants, which remain vulnerable to volatile fuel commodity prices.
From a regulatory standpoint, the sustained decline in coal generation and the flatlining of nuclear and gas capacity reflect tightening environmental standards, corporate sustainability commitments, and market forces favoring decarbonization. Furthermore, the robust growth in domestic manufacturing, spurred by federal legislation such as the Inflation Reduction Act of 2022, has localized supply chains and created hundreds of thousands of high-paying jobs in installation, engineering, and manufacturing.
As the United States approaches the summer of 2027, the data suggests that the tipping point for clean energy has arrived. With renewables on the verge of capturing the largest share of generating capacity in the nation’s history, the American energy sector has firmly turned the page toward a decentralized, low-carbon future.