The Great School Funding Debate: Why Data Disagreements Are Leaving Educators and Policymakers Confused

The American education system prides itself on the principle of equal opportunity, yet the financial reality of how the nation funds its public schools remains a source of profound national contention. For years, advocates, policymakers, and parents have been presented with diametrically opposed narratives: one suggesting that impoverished, predominantly nonwhite school districts are chronically starved of resources, and another asserting that these same districts actually receive equal or greater funding per pupil than their affluent, white counterparts. This persistent disparity in research findings—exemplified by conflicting reports from institutions like Brookings, EdBuild, the Urban Institute, EdTrust, and the Education Law Center—has created a climate of uncertainty, leaving the public to wonder whether the system is broken or simply misunderstood.
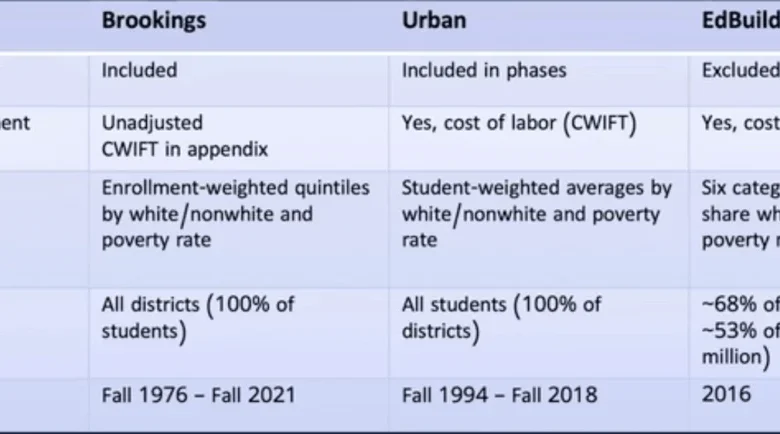
The root of this confusion lies not in the integrity of the data, but in the methodology of the analysis. When researchers attempt to measure the "fairness" of school funding, they are forced to make binary choices regarding what to include and what to exclude. By adjusting for factors like federal aid, regional labor costs, and student demographics, different researchers arrive at vastly different conclusions. To understand the landscape of American school finance, one must look beyond the final dollar figures and interrogate the mechanisms by which those numbers are calculated.

A Chronology of Conflicting Narratives
The debate over school funding is not a new phenomenon, but it has gained significant intensity over the last decade as data transparency has improved. In 2017, the Education Law Center began releasing comprehensive "Making the Grade" reports, which emphasized that many states were failing to meet the basic financial needs of low-income districts. This narrative was bolstered in 2019 by an influential analysis from EdBuild, an advocacy group that shuttered in 2020. Their report gained widespread media traction by claiming that schools in predominantly nonwhite districts received $23 billion less annually than their heavily white counterparts.
However, the tide of the conversation shifted in July 2026, when economist Sarah Reber, writing for the Brookings Institution, published a study that challenged the established wisdom. Reber’s analysis indicated that, when looking at all government sources, the highest-poverty districts—and those with the highest concentrations of nonwhite students—were, on average, receiving more funding per pupil than their wealthier peers. This finding, which was later updated to clarify trends between 2012 and 2017, served as a "statistical shock" to the education policy community, prompting a series of webinars and debates, including the August 2026 session held by EdFund, aimed at reconciling these conflicting findings.

The Mechanics of the Discrepancy
To decode these conflicting reports, one must first address the "Federal Dollar" factor. The Brookings report, which argues for higher spending in poor districts, includes all funding sources: local, state, and federal. The federal government contributes over $50 billion annually to the K-12 system, specifically targeting disadvantaged students through Title I grants, special education funding, and subsidized school meal programs. When this massive injection of federal cash is included in the per-pupil equation, the financial profile of high-poverty districts improves significantly.
Conversely, researchers at EdBuild and the Education Law Center have historically excluded federal dollars from their calculations. Their rationale is grounded in the belief that federal aid is intended to be a supplement, not a substitute for state and local responsibility. From their perspective, including federal dollars obscures the reality that many states are failing to provide equitable state and local funding. If a state relies on federal "bridge" funding to keep a district afloat, critics argue that the state is effectively "passing the buck" and neglecting its constitutional duty to provide a robust education for all children.

Regional Costs and the Illusion of Wealth
A second major point of divergence is the adjustment for regional cost differences. A dollar spent in a rural, low-cost district in Alabama has vastly different purchasing power than a dollar spent in the hyper-expensive Bay Area of California. Because teacher salaries—the single largest expense for any school district—fluctuate wildly based on the local cost of living, raw per-pupil spending figures can be deceptive.
Some reports, such as those from the Urban Institute, offer tools to view data both with and without labor-cost adjustments. When researchers adjust for the fact that urban districts must pay significantly higher salaries to attract talent, the "funding gap" often appears to widen. For instance, a district might be spending more dollars per pupil than a rural neighbor, but because it is located in an expensive metropolitan hub, that money buys fewer teachers, smaller support staffs, and fewer resources. This nuance is critical: it reveals that while the total cash flow might seem higher in nonwhite or urban districts, the functional "educational power" of those dollars is often lower.

The Intersections of Race and Poverty
Perhaps the most complex layer of the funding debate is the distinction between poverty and race. While poverty and race are deeply intertwined in the American context, they do not perfectly overlap in terms of school funding outcomes. Many poor students reside in rural, predominantly white districts, which often benefit from different state funding formulas than urban, predominantly nonwhite districts.
Evidence suggests that when researchers aggregate data based solely on poverty, the results look different than when they aggregate by race. For example, recent findings from EdTrust suggest that while districts serving mostly Black, Hispanic, and Native American students consistently receive fewer state and local dollars than those serving white students, the same is not always true for districts categorized purely by socioeconomic status. The high cost of labor in urban centers—where Black and Hispanic populations are disproportionately concentrated—means that even when funding levels appear comparable, the ability to provide adequate support systems, such as mental health counselors and reading specialists, remains compromised.

Implications for Policy and Equity
The lack of a consensus on school funding is more than just an academic disagreement; it has tangible impacts on how state legislatures allocate budgets. If policymakers rely on data suggesting that "poor districts are already getting more money," they may be less inclined to approve tax hikes or redistribute funds to bridge the achievement gap. Conversely, if advocates exclusively push the "starvation" narrative without acknowledging the significant federal investment, they may fail to hold state governments accountable for their specific portion of the funding equation.
Experts like Bruce Baker of the University of Miami have long argued that the debate should move away from the binary of "who gets more" and toward the question of "what does it actually cost to educate a child?" Baker’s research suggests that providing an equitable education for students in high-poverty areas can require thousands of dollars more per pupil than the national average. When viewed through this lens, the current debates seem to miss the broader point: regardless of which side of the ledger the math falls on, the system is currently failing to meet the actual needs of students who face the highest barriers to academic success.

Furthermore, the geographic lottery continues to be the most significant factor in school funding. As noted in the 2025 report from the Education Law Center, a student’s educational experience is heavily dictated by their state of residence. Disparities in state-level taxation, economic health, and political priorities result in a situation where a child in New York may receive $17,000 more in per-pupil investment than a peer in Idaho. This state-to-state inequality persists regardless of the debates over poverty or race, suggesting that the "fairness" problem is as much about federalism and state tax policy as it is about local school district budgets.
Moving Forward
The path toward a more equitable system requires a more sophisticated engagement with the data. When evaluating future reports, stakeholders must apply three diagnostic questions: Which revenue sources are included? Have the figures been adjusted for regional cost-of-living and labor market variables? And, most importantly, what is the comparison group?

By moving past the simplified "more vs. less" headlines, researchers and policymakers can begin to address the underlying structural inequities that remain. The goal of school funding should not be merely to ensure that every district receives an equal slice of the pie, but to ensure that every student, regardless of their zip code, race, or family income, has access to the specialized resources required to thrive in a modern economy. Until the conversation shifts from defending specific funding narratives to identifying the actual costs of closing the achievement gap, the American public will likely remain caught in this cycle of confusion, while millions of students remain under-resourced.
Related posts: