How Scientists and Public Health Authorities Calculate the Death Toll of Europe’s Record-Breaking Summer Heatwaves

Europe has recently emerged from a series of record-shattering heatwaves that spanned the months of May and June, leaving public health authorities and climate scientists to grapple with a grim accounting of the human cost. As temperatures soared across the continent, surpassing historical norms by significant margins, a flurry of reports has attempted to quantify the mortality associated with these extreme weather events. In France, the national public health agency reported over 2,000 excess deaths during the peak of the June heatwave, while German authorities estimated the toll at more than 5,700 for the same period. These figures, while staggering, represent more than just raw data; they are the result of complex, often diverging scientific methodologies designed to capture a "silent killer" that rarely appears as a primary cause on a death certificate.
The challenge of quantifying heat-related mortality is multifaceted. Unlike a flood or a hurricane, where the cause of death is often immediate and obvious, extreme heat exacerbates underlying conditions, placing fatal strain on the cardiovascular and renal systems. Consequently, the scientific community employs various techniques—ranging from simple excess mortality counts to sophisticated statistical modeling and climate attribution—to understand the true impact of a warming planet on human survival.
A Chronology of the 2026 Summer Heatwaves
The summer of 2026 began with an unusually warm May, particularly in the United Kingdom and Western Europe. By late May, temperatures in England and Wales were already triggering health alerts. Research conducted by Imperial College London and the Met Office suggests that this early-season heat resulted in approximately 553 deaths between May 24 and May 26 alone.
However, it was the month of June that brought unprecedented extremes. From June 12 through June 29, a persistent high-pressure system trapped hot air over the continent, leading to a prolonged period of intense heat. France, Spain, Germany, and the Netherlands saw temperatures climb well above 40 degrees Celsius in many regions.
The peak of this crisis occurred between June 22 and June 28. During this seven-day window, the EuroMoMo mortality monitoring system, which tracks data across 27 European countries, estimated a staggering 10,650 excess deaths. In Germany, the Federal Statistical Office (Destatis) recorded 23,932 total deaths during that week—a 32% increase over the four-year average for that calendar period. France reported 2,025 excess deaths in the same timeframe, while the Netherlands saw an additional 577 fatalities beyond expected norms.

The Methodology of Counting the Dead
Because heat is rarely listed as the primary cause of death, scientists must infer its impact. There are currently three primary schools of thought regarding how to tally these losses: the "excess deaths" approach, statistical modeling, and death-certificate coding.
The Excess Deaths Approach
The most immediate method used by government agencies like Destatis in Germany and RIVM in the Netherlands is the calculation of excess mortality. This approach compares the total number of deaths recorded during a heatwave to a baseline average from the same period in previous years.
The primary advantage of this method is its speed and reliance on "ground truth" data. It allows public health officials to issue rapid reports that inform emergency responses. However, the method is not without flaws. It does not distinguish between deaths caused by heat and those caused by other concurrent factors, such as a localized viral outbreak. Furthermore, the choice of the "baseline" period—whether it is a five-year average or a ten-year average—can significantly alter the final tally. Experts note that the COVID-19 pandemic years have further complicated these baselines, as the virus caused massive spikes in mortality that can skew contemporary comparisons.
Statistical Modeling and the U-Shaped Curve
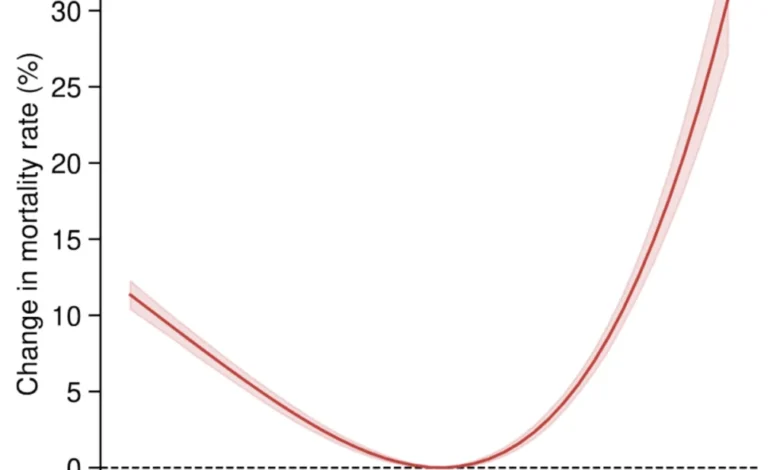
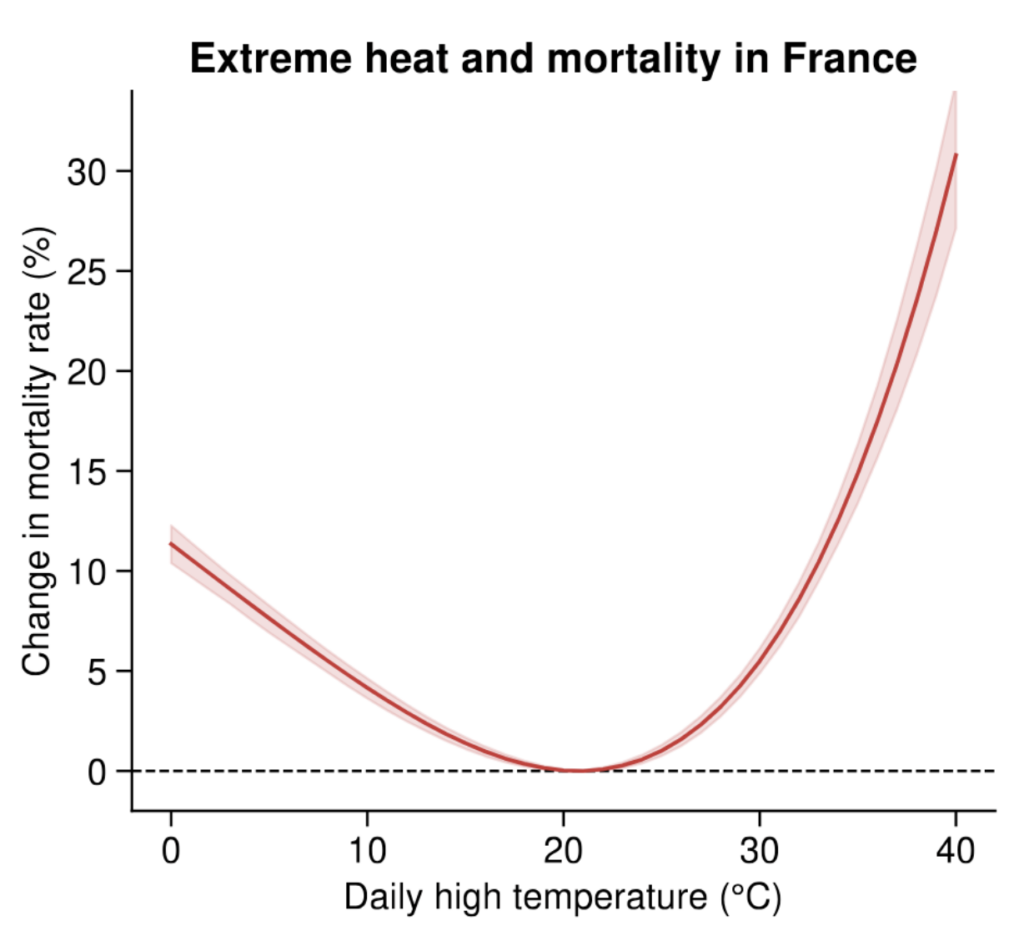
In contrast to the raw counting of excess deaths, many academic researchers prefer statistical modeling. This method seeks to establish a mathematical relationship between temperature and mortality. Historically, this relationship is "U-shaped": deaths are higher during extreme cold and extreme heat, with a "sweet spot" or optimum temperature where mortality is lowest.
In France, research published in the Proceedings of the National Academy of Sciences indicates that mortality begins to rise sharply once daily maximum temperatures exceed 20°C. By applying this curve to the specific temperatures recorded during the 2026 heatwave, scientists like Dr. Christopher Callahan of Indiana University can estimate how many deaths were specifically "heat-attributable."
Prof. Antonio Gasparrini, a biostatistician at the London School of Hygiene and Tropical Medicine (LSHTM), explains that modeling allows researchers to "smooth" out seasonal trends and control for long-term shifts in population health. It can also account for the "lag effect," where a person’s health may decline over several days of exposure before they succumb to the heat.
Death-Certificate Coding
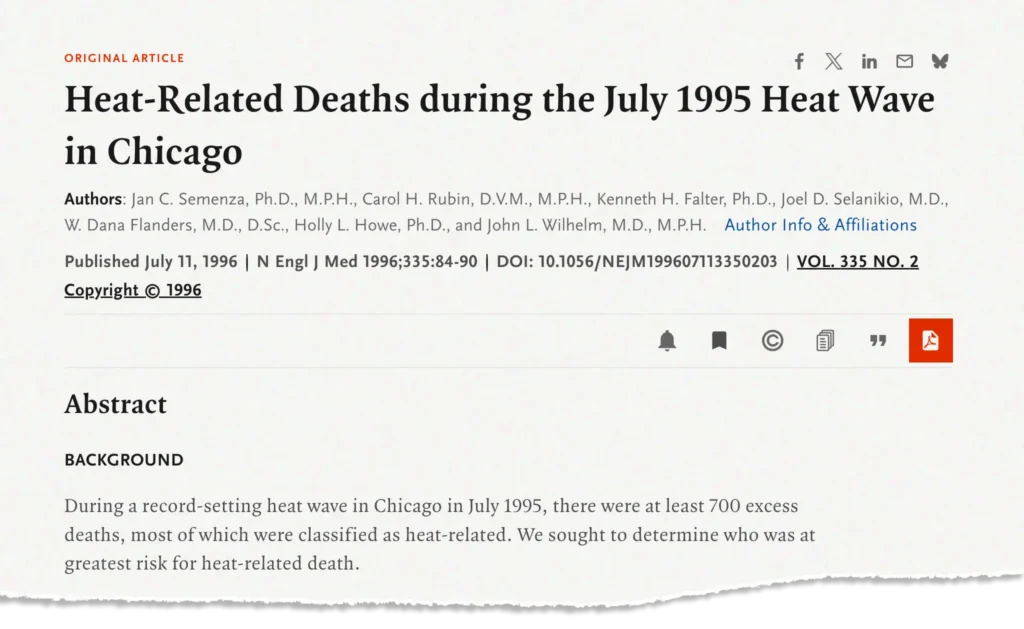
The least common method in Europe, but one still used in parts of the United States, is the direct coding of heatstroke or "heat-related illness" on death certificates. While this provides a direct link, it is widely considered an undercount. In July 2026, for example, New York City reported only three heat-related deaths during a historic stretch of high temperatures, a figure that almost certainly misses the hundreds of cardiovascular failures likely triggered by the same weather.
The Role of Human-Caused Climate Change
A significant evolution in heatwave science over the last decade is the ability to attribute specific deaths to human-induced global warming. This "two-step" process involves first calculating the total heat-related deaths and then using climate models to simulate a "counterfactual" world—one where industrialization and carbon emissions never occurred.
A landmark study on the 2003 European heatwave found that 506 of the 735 summer fatalities in Paris were a direct result of human influence on the climate. In the 2026 analysis for England and Wales, researchers found that 42% of the 2,700 heat deaths across May and June were attributable to climate change. This suggests that without the warming caused by fossil fuel combustion, over 1,100 people in the UK would have survived the summer.
Dr. Callahan notes that this field of research has "exploded" recently because it requires a rare intersection of epidemiology and climate physics. "You need people who know how to run the epidemiological models and you need a climate analysis of the counterfactual world," he said.
Scientific Consensus vs. Skepticism
The rise of modeled estimates has not been without controversy. Some commentators and academics have questioned the reliability of these figures when they do not align perfectly with provisional "all-cause" mortality data. In the UK, a blog post by Oxford academics, later amplified by media outlets like GB News, argued that modeling "tells us nothing" and that surveillance of actual death records should be the only metric.
However, public health experts defend the models as essential tools. Dr. Garyfallos Konstantinoudis of the Grantham Institute emphasizes that the methodology used to reach the 2,700 figure in the UK has consistently aligned with official government analyses once the final, non-provisional data is released. He points out that air pollution was also ignored on death certificates for decades, despite being a well-documented killer. "The messaging for heat is more recent, but the science is robust," he argues.
Physiological Impacts and Broader Implications
The reason heat is so deadly lies in the body’s struggle to maintain a stable internal temperature. To cool down, the heart must pump faster to move blood to the skin’s surface, and the kidneys must work harder to manage electrolyte balances as the body sweats. For the elderly or those with pre-existing conditions like dementia or Alzheimer’s, this physiological strain can be insurmountable.
The implications of these findings are profound for urban planning and public policy. As heatwaves become more frequent, intense, and longer-lasting, the current "reactive" approach to public health may no longer be sufficient.
- Urban Heat Islands: Cities are often several degrees warmer than rural areas due to concrete and lack of vegetation. Data from these studies is being used to advocate for "green roofs" and increased canopy cover.
- Early Warning Systems: The 2026 data shows that early-season heat (May) can be just as deadly as mid-summer heat because the human body has not yet had time to acclimatize.
- Energy Policy: There is a growing debate over the "cooling paradox"—the need for air conditioning to save lives versus the carbon emissions produced by the energy required to run those units.
Conclusion
The data emerging from Europe’s 2026 summer serves as a sobering reminder of the vulnerability of human populations to a changing climate. Whether through the lens of excess deaths or the precision of statistical modeling, the conclusion remains the same: extreme heat is a major public health crisis. As scientists refine their ability to count the dead and attribute those losses to global warming, the pressure on policymakers to implement drastic adaptation and mitigation strategies will only continue to mount. The "silent killer" is finally being heard, through the rigorous and evolving language of mortality science.