The Silent Toll of Europe’s Record-Breaking Heatwaves and the Evolving Science of Mortality Attribution


Europe’s public health infrastructure is currently grappling with the devastating aftermath of a record-breaking summer, as a series of intense heatwaves in May and June 2026 have left thousands dead across the continent. While the physical intensity of the heat was captured by satellites and thermometers, the human cost is only now becoming clear through a complex tapestry of epidemiological reports and climate attribution studies. Recent data from national health agencies in France, Germany, the Netherlands, and the United Kingdom suggest that the excess death toll has surged into the tens of thousands, sparking a renewed debate over how society measures and responds to the invisible lethality of extreme heat.
In Germany, the federal statistics agency Destatis reported a staggering 5,753 excess deaths during the final week of June alone, representing a 32% increase over the four-year average for that specific calendar period. France’s national public health agency, Santé Publique France, mirrored this grim reality, reporting 2,025 excess deaths during the peak of the June heatwave. Meanwhile, the EuroMoMo mortality monitoring system, which tracks data across 27 European nations, estimated that more than 10,500 excess deaths occurred during the late June peak, underscoring the continental scale of the crisis.

A Chronology of Extreme Heat: May to June 2026
The 2026 heat crisis began prematurely in May, with an unusual high-pressure system settling over Western Europe and the British Isles. This "mind-boggling" early-season heat laid the groundwork for vulnerability, particularly among the elderly and those with pre-existing conditions. By the time the second, more intense heatwave arrived in mid-June, urban centers were already struggling with elevated "night-time minimum" temperatures, which prevent the human body from recovering from daytime thermal stress.
The timeline of the crisis highlights the rapid escalation of mortality:
- May 21–29: The first significant heat event strikes the UK and Western Europe. Researchers from Imperial College London and the Met Office later estimated 553 deaths in England and Wales during this brief window.
- June 12–18: Temperatures begin to climb steadily across France and Iberia.
- June 22–28: The peak of the crisis. Records are shattered in Germany and the Netherlands. During this seven-day period, the majority of the season’s fatalities occurred.
- Early July: Public health authorities begin releasing preliminary data, with figures being revised upward as more "all-cause mortality" data becomes available from regional registries.
The Invisible Killer: Why Heat Deaths are Hard to Count
Unlike a flood or a hurricane, where the cause of death is often immediate and obvious, heat is a "silent killer" that rarely appears as the primary cause on a death certificate. Exposure to extreme temperatures places immense strain on the cardiovascular and renal systems as the body works to cool itself through vasodilation and sweating. Consequently, most heat-related deaths are recorded as heart failure, kidney disease, or respiratory distress.
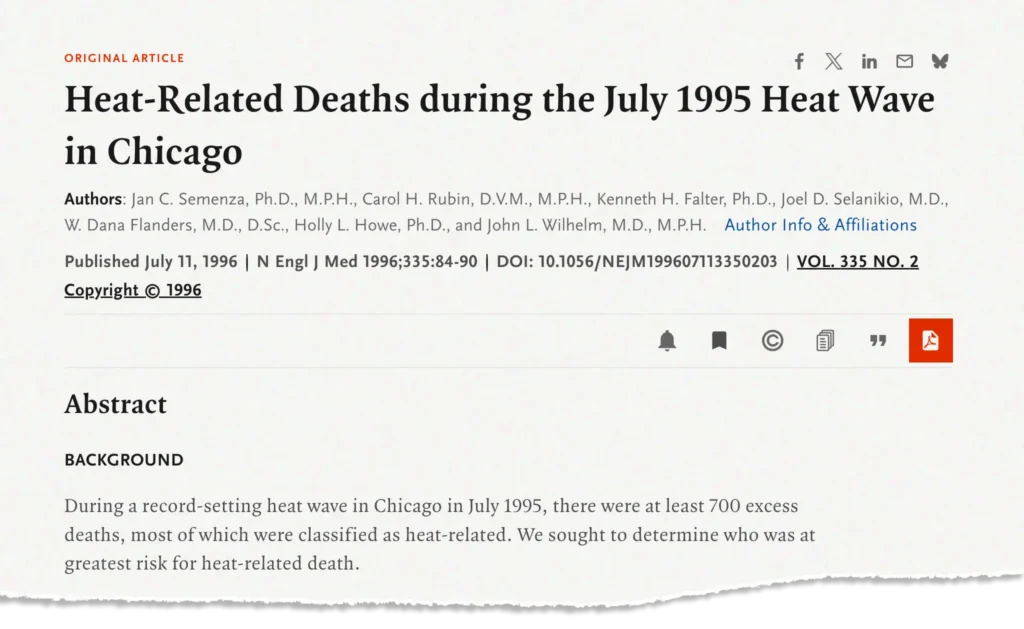
Dr. Garyfallos Konstantinoudis, a researcher at the Grantham Institute for Climate Change and the Environment, notes that there is "no ground truth" in tallying these fatalities. Instead, scientists must rely on sophisticated modeling to fill the gaps left by traditional medical coding. This lack of direct attribution has historically led to an underestimation of the risks associated with rising global temperatures. Only recently, following the landmark 2003 European heatwave that killed an estimated 70,000 people, has the scientific community refined its ability to link specific weather events to mortality spikes.
Methodology 1: The "Excess Deaths" Approach
The most immediate method used by government agencies like Destatis in Germany and RIVM in the Netherlands is the "excess deaths" approach. This involves comparing the total number of deaths recorded during a heatwave to a historical baseline—usually an average of deaths during the same week over the previous three to five years.
Pros and Cons:
The primary advantage of this method is speed. It allows public health officials to issue rapid alerts and understand the scale of a crisis in real-time. However, the method is "noisy." It captures all deaths, including those potentially caused by other factors like a late-season flu spike or a pandemic. Furthermore, the choice of the baseline period is critical; if the baseline years were also unusually hot, the "excess" might appear smaller than it actually is, masking the true impact of climate change.
Methodology 2: Statistical Modeling and the U-Curve
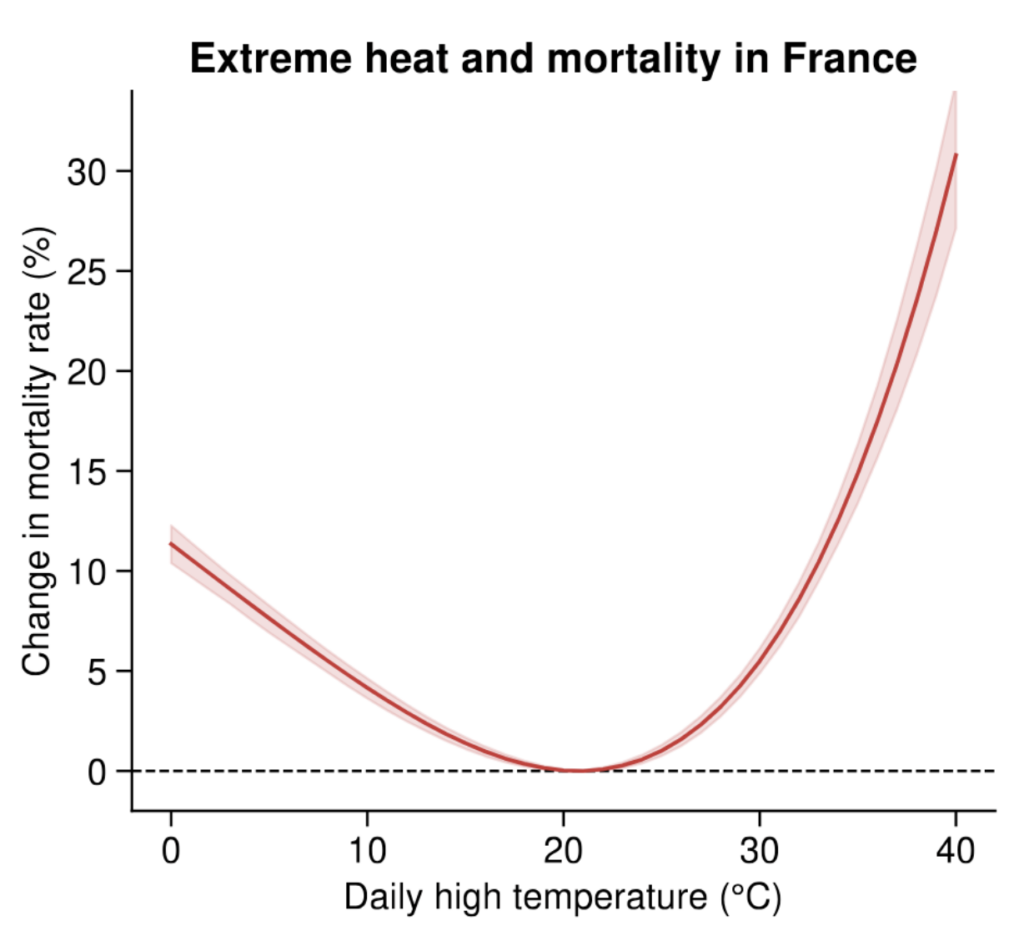
Academic researchers increasingly favor "statistical modeling" to isolate the specific impact of temperature. This method relies on the established "U-shaped" relationship between temperature and mortality. In most temperate climates, there is an "optimum temperature" (often around 20°C in Western Europe) where mortality is lowest. As temperatures move into extreme cold or extreme heat, deaths rise exponentially.
A recent analysis for Carbon Brief by Dr. Christopher Callahan of Indiana University and Prof. Andrew Dessler of Texas A&M University used this method to estimate that more than 2,700 people died in France over a 17-day period in June. By using decades of historical data to build a temperature-mortality curve, they could infer how many deaths were specifically attributable to the mercury rising above the "optimum" threshold.
The Fingerprint of Climate Change
One of the most significant shifts in modern heatwave analysis is the ability to attribute deaths directly to human-caused global warming. This "two-step" process involves creating a "counterfactual" model—a simulation of what the weather would have been like without the carbon emissions accumulated since the Industrial Revolution.
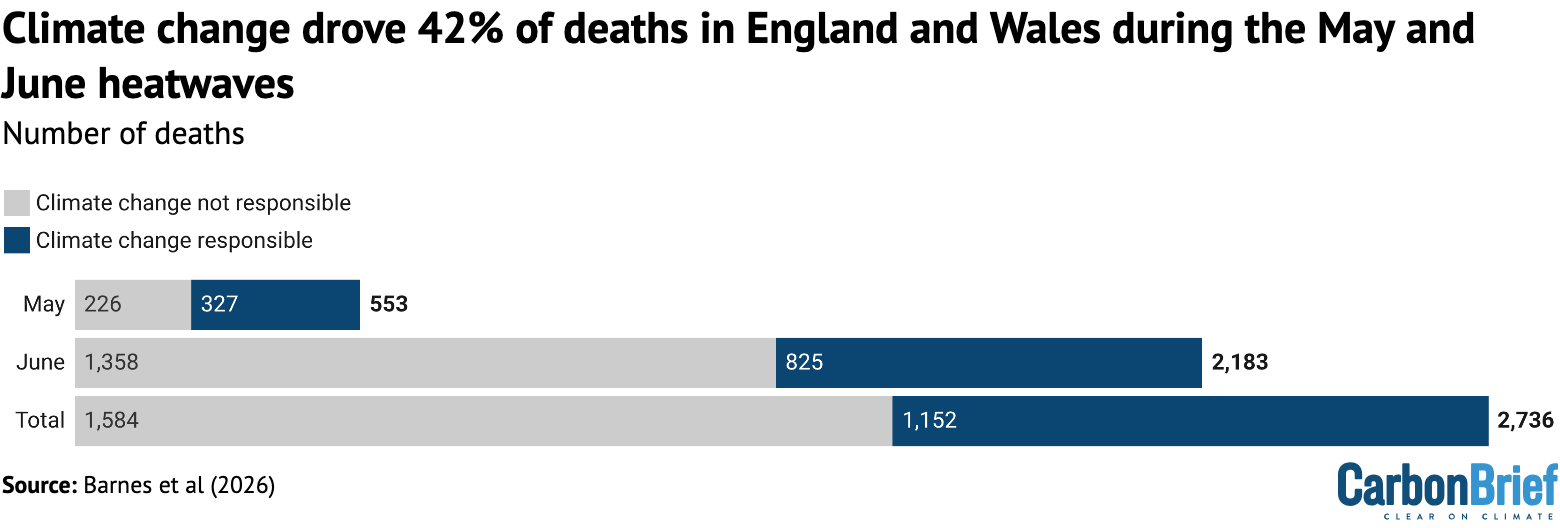
The Imperial College and Met Office study on the 2026 UK heatwaves found that human-caused climate change was responsible for approximately 42% of the heat-related deaths. Specifically, they estimated that 59% of the May fatalities and 38% of the June fatalities would not have occurred in a world without climate change. This type of attribution science is critical for legal and policy frameworks, as it moves the conversation from "natural disasters" to "man-made hazards."
Official Responses and Public Skepticism
The release of these figures has not been without controversy. Some critics, including climate-skeptic commentators, have argued that modeled estimates are merely "hypotheses" that do not reflect reality. In the UK, a blog post by Oxford academics suggested that the 2,700 figure was not immediately visible in the provisional "all-mortality" data from the Office for National Statistics (ONS).
However, public health experts argue that this skepticism stems from a misunderstanding of how data is processed. The UK Health and Security Agency (UKHSA) typically waits months to release its annual heat mortality report to ensure that data is cleaned and that "lagged" deaths—those that occur days after a heatwave ends due to accumulated bodily stress—are included.

Dr. Konstantinoudis emphasizes that while the findings are modeled, the methodology has consistently aligned with observed outcomes in past events. "We need to look at both excess deaths and statistical modeling together to get a holistic view," he explained.
Broader Implications for Public Health and Urban Planning
The 2026 data serves as a stark warning for the future of European urban centers. As the continent warms at a rate faster than the global average, the "Urban Heat Island" effect—where concrete and asphalt trap heat—is turning cities into death traps for the vulnerable.
The implications of these mortality reports are three-fold:

- Infrastructure Adaptation: There is an urgent need for "cool-room" mandates in care homes and hospitals. In many parts of Northern Europe, air conditioning is rare, and buildings are designed to retain heat rather than shed it.
- Early Warning Systems: The disparity between different national death tolls suggests that some countries have more effective "Heat-Health Action Plans" than others. France, for instance, implemented aggressive public messaging and "check-in" systems following the 2003 disaster, which likely prevented the 2026 figures from being even higher.
- Economic Impact: Beyond the human tragedy, the loss of life and the strain on healthcare systems represent a significant economic burden. Economists are increasingly using these mortality models to calculate the "Social Cost of Carbon," providing a financial incentive for rapid decarbonization.
As Europe concludes its assessment of the 2026 summer, the data confirms a grim reality: heatwaves are no longer just uncomfortable weather events; they are major public health emergencies. The refinement of mortality science ensures that these deaths are no longer invisible, placing the responsibility for adaptation and mitigation squarely on the shoulders of policymakers. The thousands of lives lost in May and June are a testament to a changing climate that is outpacing the continent’s current ability to protect its most fragile citizens.